Visual Analytics
Welcome to ISSS608 Visual Analytics and Applications, Spring 2024 class!
This page documents my learning journey of geospatial analytics taught by Prof Kam Tin Seong.
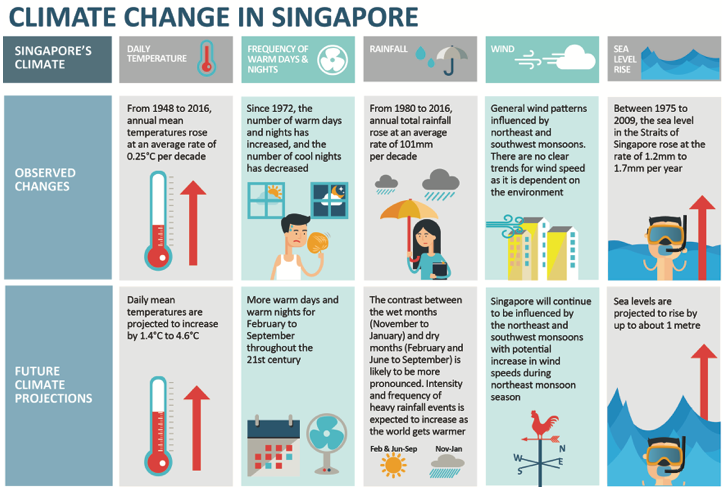
Source: Autodesk
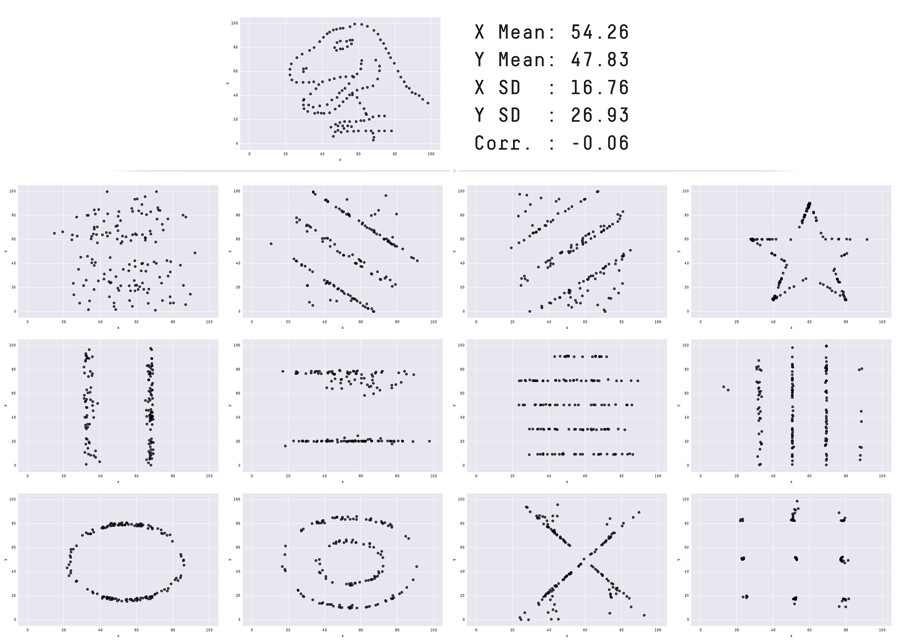
This is the Datasaurus Dozen. While different in appearance, each dataset has the same summary statistics (mean, standard deviation, and Pearson’s correlation) to two decimal places.
What is Visual Analytics?
Visual Analytics is the craft of analytical reasoning supported by:
- Data Science and Analytics
- Data Visualization
- Human Computing Interaction (HCI)
- Interface Design
- Visual Storytelling
The learning objective is to understand the basic concepts, theories and methodologies of visual analytics, analyse data using appropriate visual thinking and visual analytics techniques, and implement cutting-edge visual analytics system for decision making.
Topic Overview


No matching items